What is a Spend Analytics Dashboard?
Spend Analytics Dashboard
Power BI
What’s a Spend Analytics Dashboard
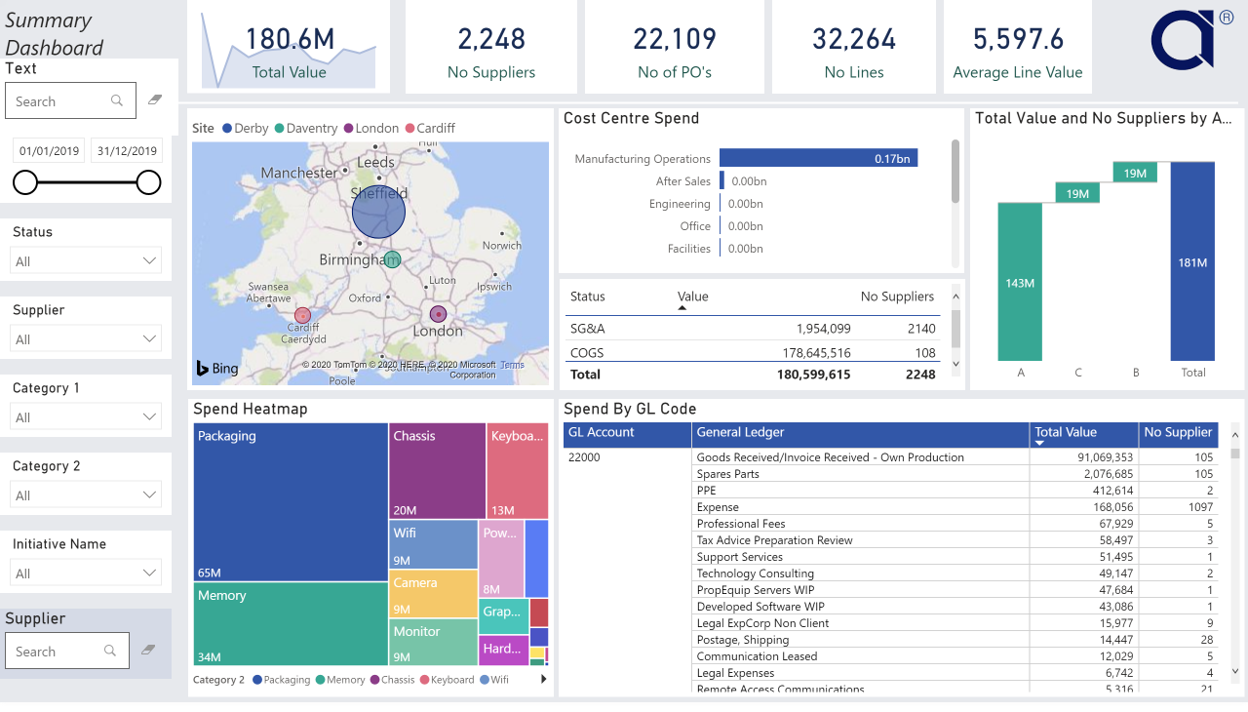
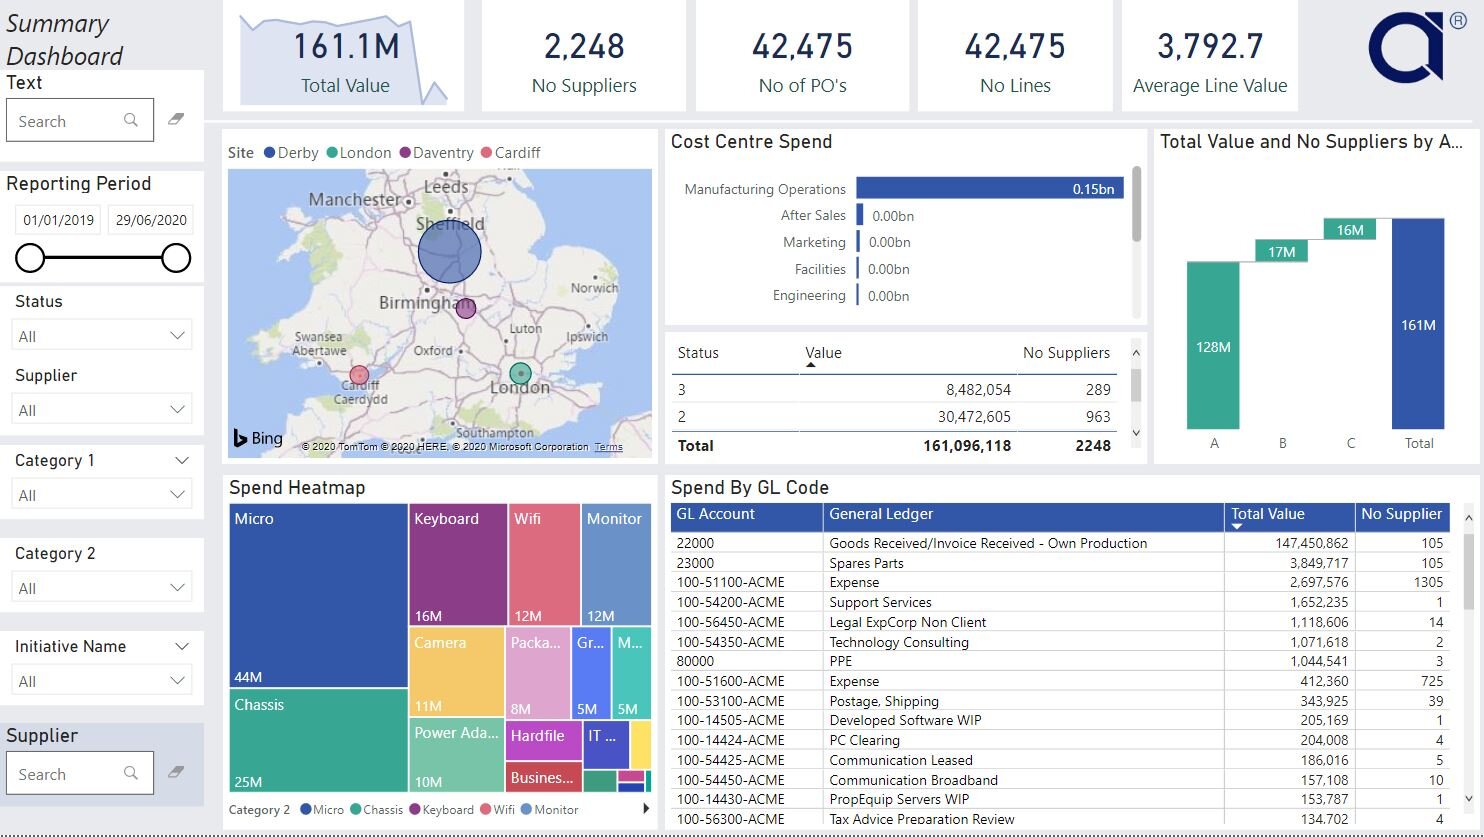
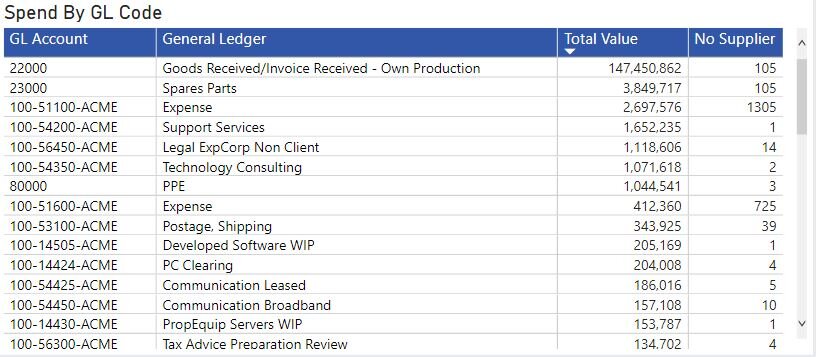
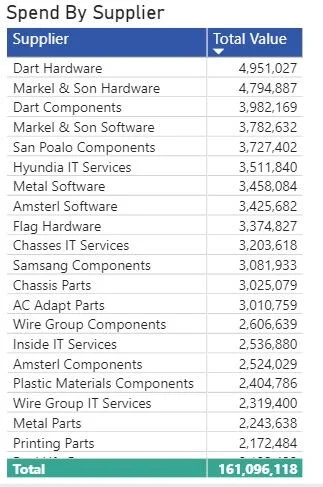
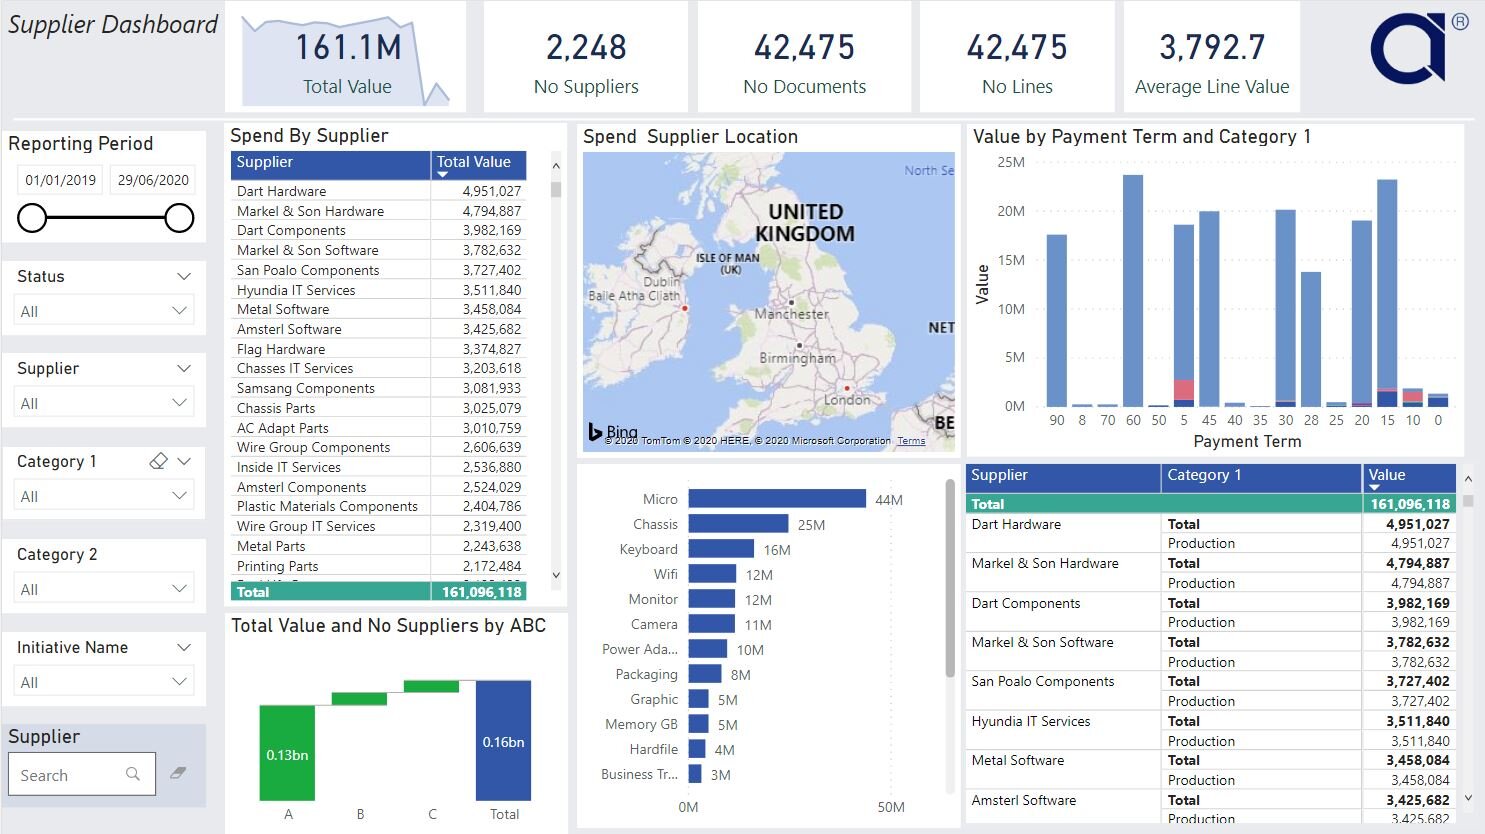
Spend Analytics Dashboard is visualization tool, which connect, transform, load, publish and share spend data. A spend analysis dashboard, is a collection of predefined spend charts or graphs within a business intelligence application, then published and shared.
The Spend Analytics Dashboard is split into the following steps:
Connect to Spend Data
Transform Spend Data
Load Spend Data
Publish Data
Share Data
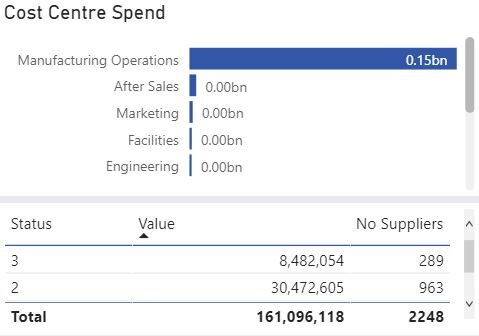
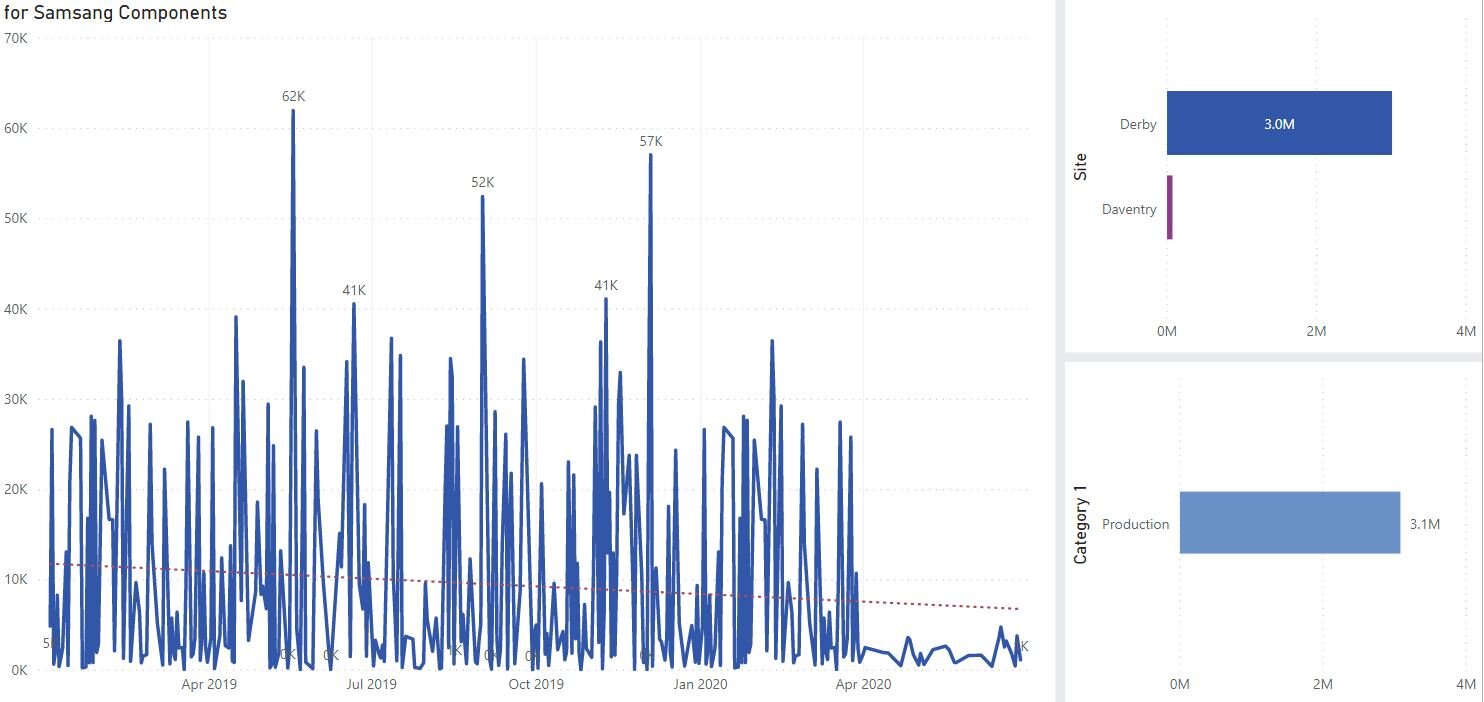
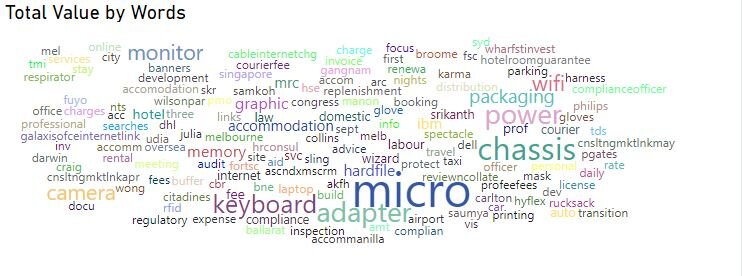
A Spend Analytics Dashboard is a data visualization tool that displays the current status of the company spend metrics and (KPIs). Spend Dashboards connect and analyse procurement spend data, with built-in text analysis, identify trends, outliers and valuable insights, which help management make informed business decisions by transforming raw spend data into valuable insights.
To achieve this bespoke Spend Analytics Software is used.
Spend Analytics Dashboards
The following video, shows a Spend Analytics Dashboard in Power BI.
Spend Analytics Dashboard - Video YouTube
Spend Analytics Dashboard using Power BI.
Procurement Spend Analysis Process
Sometimes referred to as a Spend Cube or Procurement Spend Analysis, allows data, to be connected.
A Procurement Spend Analysis process is used to address sourcing decisions and contains the following List :
• ABC or Pareto Analysis
• Number of Suppliers
• Number of Transactions
• Spend Analytics
• Average transaction costs
• Currency
• Invoice date
• unit cost
• Total Spend Value
Power BI allows the user to create a template, using a predefined spend analysis format.
Spend Opportunity Assessment
Spend analysis Dashboard takes Spend data and creates a method for users to consume it, easily and quickly. Data Visualisation is essential creating insightful, data-driven cost optimization.
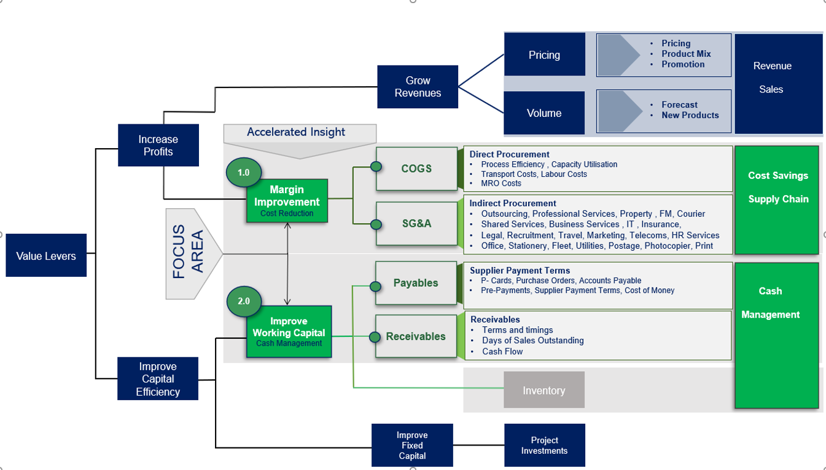
The output of which provides procurement with Spend Opportunity Assessment.
▶ YouTube
What is a Spend Analytics Dashboards

